If you aren’t monitoring your environments, how do you find out when there are problems?
- Find problems before your users do
- Reduce downtime and service outages
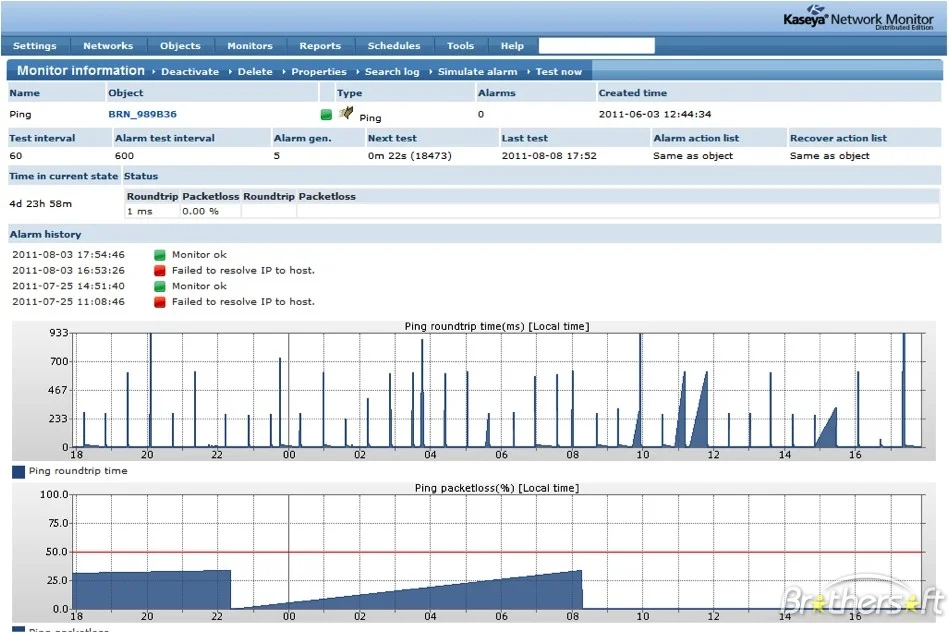
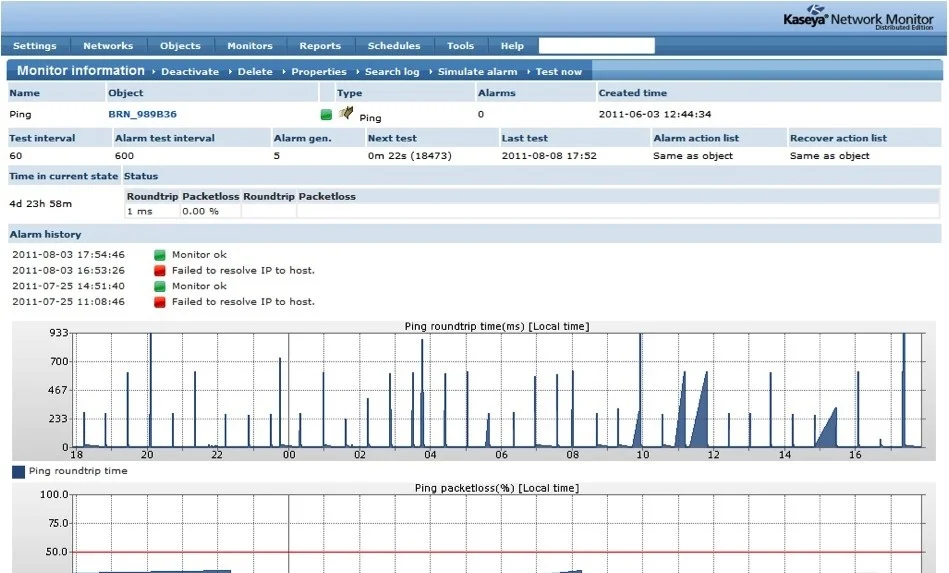
- Over 45 different types of native monitors ranging from ping to quality of service monitors
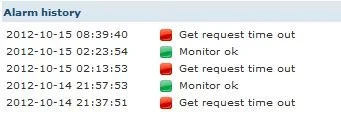
- Get notified of service problems or set up automatic resolution
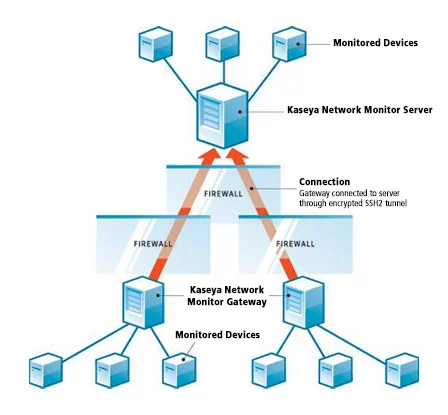
- Completely agentless – nothing to install on endpoints
- 100% web browser accessible
The number of users that run into a problem on critical systems increases exponentially with time.
Early warning allows for user notification and redundancy measures. Automatic resolution potentially eliminates any user downtime.
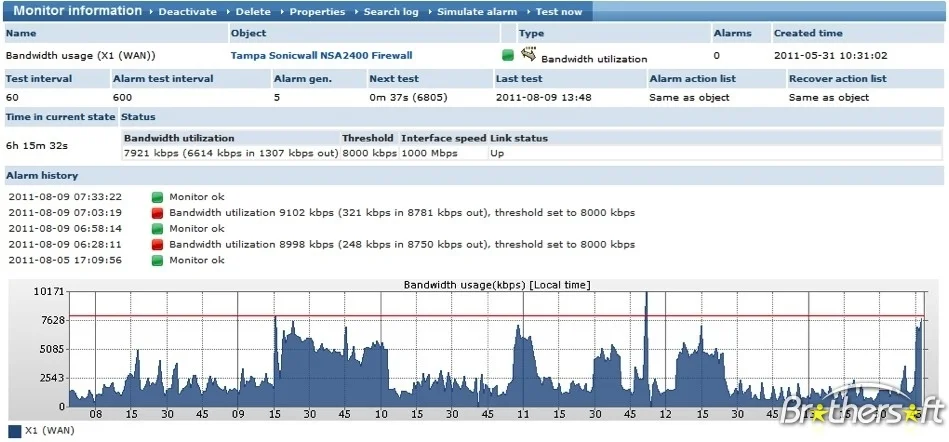
TCD Network Monitor includes the basics for monitoring all aspects of network connected devices beginning with the performance monitoring: Network bandwidth, CPU, disk, and memory utilization. On Windows platforms, both Windows performance registry counters and WMI queries are available.
The SNMP trap monitor has advanced filtering capabilities and alarm conditions can be setup to respond to specific properties of the received trap. There is also the SNMP query monitor that can poll specified OID’s, perform a simple calculation, and compare the result with a specified value.
VMWare monitor utilizes the native VMWare APIs to query key host metics. Supports most performance counters objects, such as hosts, datastores, and virtualstores.
Mail Quality of Service monitor makes it possible to can test the ability of a mail server to send and receive mail. Statistics about round trip time, time to send and login time is stored.
The file and directory monitoring can monitor if a file exists, how many files there are in a directory, if the total content of a directory is growing or check if new files are added on a schedule.
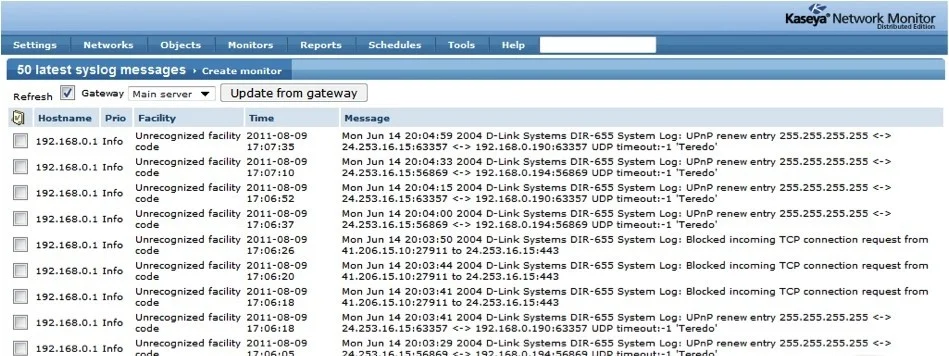
Log monitoring can trigger notifications and other actions when a log message is encountered that matches a pre-defined filter. Windows event log, Linux/Unix syslog and text log files are supported.
Database monitoring includes support for monitoring Oracle, MySQL, Microsoft SQL Server and a generic ODBC monitor for use with other DBMS. All of the monitors can perform a SQL query as well as additional performance monitoring specific to each DBMS.

